This section provides the structure of the total overdue debt for various different tax types for the financial years from 2008 to 2017.
The data for these statistics is available for download from the links at the bottom of the page.
Graph of overdue debt by tax type from 2008 to 2017
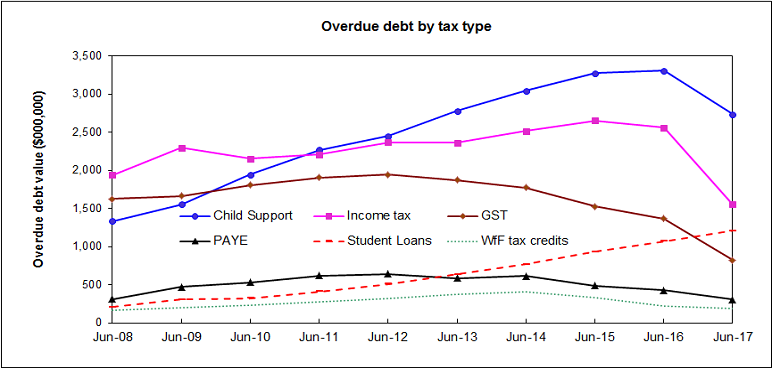
The graph has six lines, showing the value of overdue debt for the following:
- Child support
- income tax
- GST
- PAYE
- student loans
- Working for Families Tax Credits.
The graph covers the years ending June 2008 to June 2017.
Over the decade, the value of overdue:
- tax debt decreased 5% (from $4,413m to $ 4,199m)
- child support debt increased 105% (from $1,338m to $2,736m).
More specifically:
- income tax debt decreased 20% (from $1,942m to $1,556m)
- GST debt almost halved , decreasing by 49% (from $1,629m to $826m)
- PAYE debt decreased 1% (from $312m to $310m)
- student loan debt increased 482% (from $208m to $1,207m)
- Working for Families Tax Credits debt increased 15% (from $169m to $193m).
Last updated:
28 Apr 2021