All current KiwiSaver data, including monthly data, is available in Excel downloads located on the Datasets for KiwiSaver statistics page. Annual data is due to be uploaded by 30 September.
Information on the number of scheme transfers by month for the financial year is available in the KiwiSaver annual Excel download.
Datasets for KiwiSaver statistics
Number of member transfers between schemes as at 30 June
This graph shows the number of member transfers between schemes as at 30 June 2025.
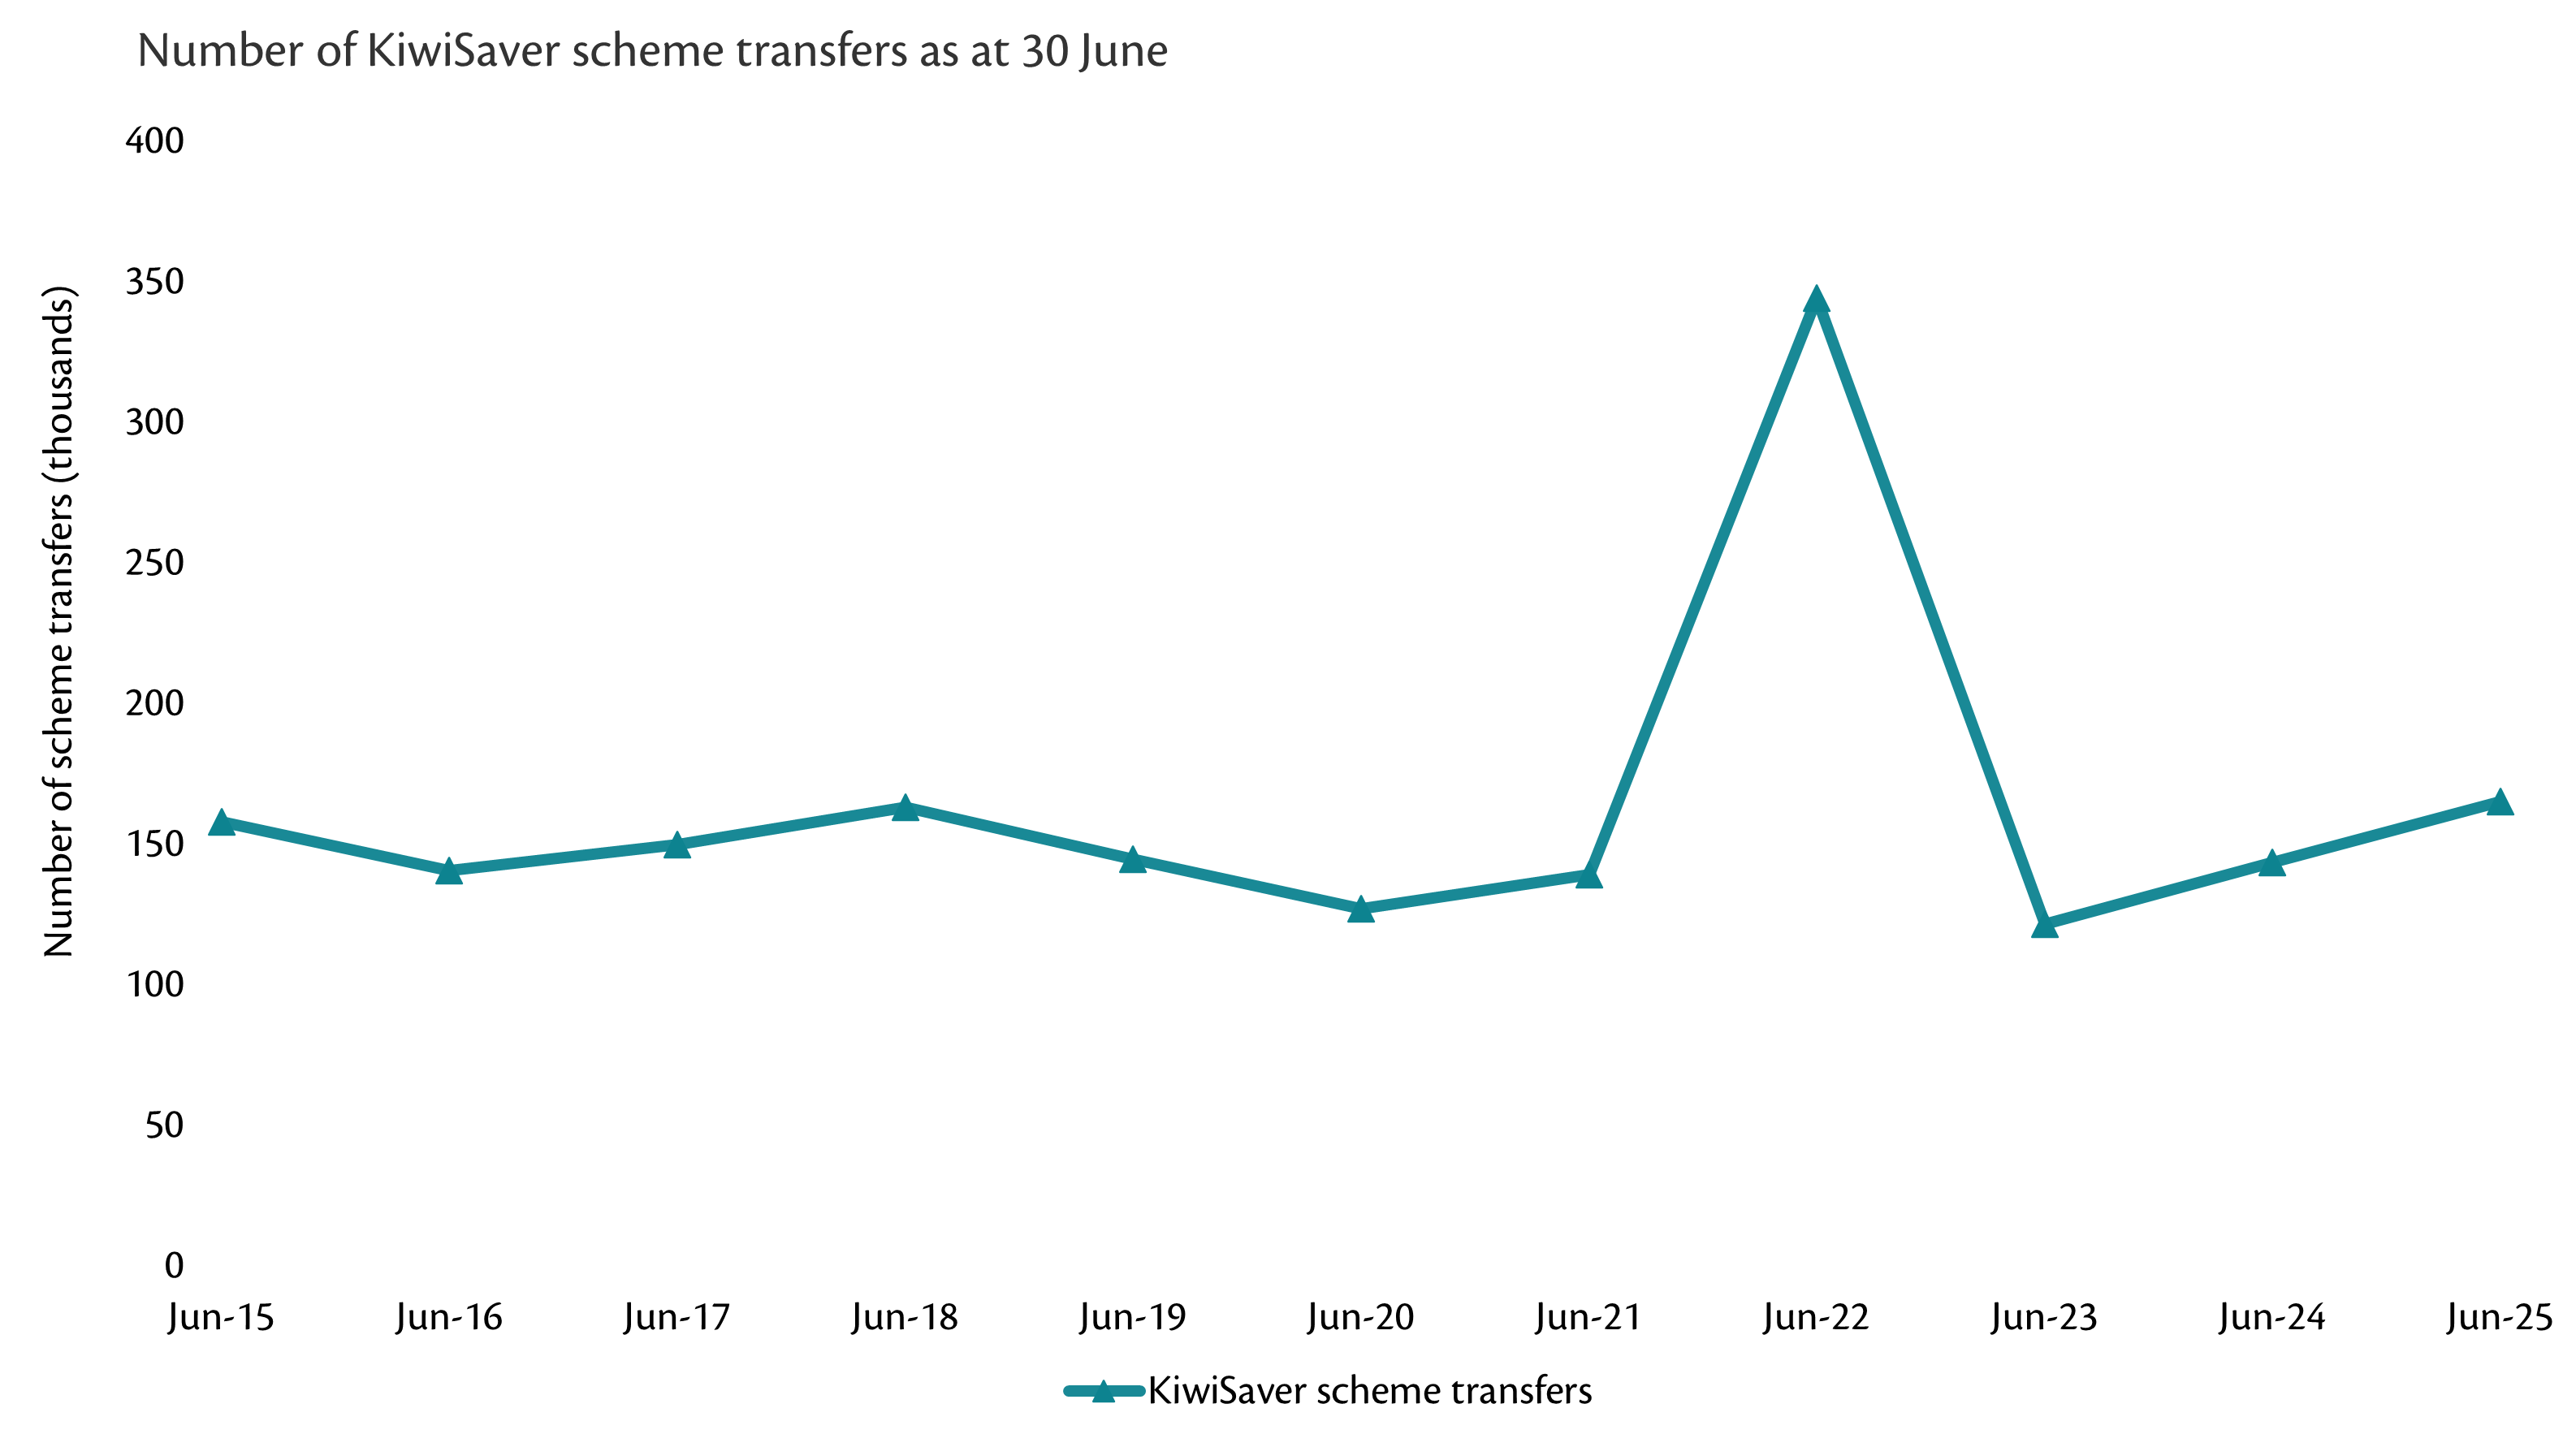
The number of scheme transfers increased, from 157,809 in the 2015 financial year to 164,929 in the 2025 financial year.
Notes:
- Figures do not include transfers within the provisional period of 8 weeks.
- Figures only represent transfers within KiwiSaver schemes, transfers within complying funds are excluded.
- Figures exclude transfers as a result of scheme mergers.
- The 2022 financial year shows a large number of transfers due to the outcomes of the default provider review that took place in December 2021.
- From April 2020, KiwiSaver information is reported from a new system.
Speed of transfer of employer contributions from IR to scheme providers
This graph shows the speed of transfer of employer contributions from IR scheme providers for the 2024-2025 financial year.
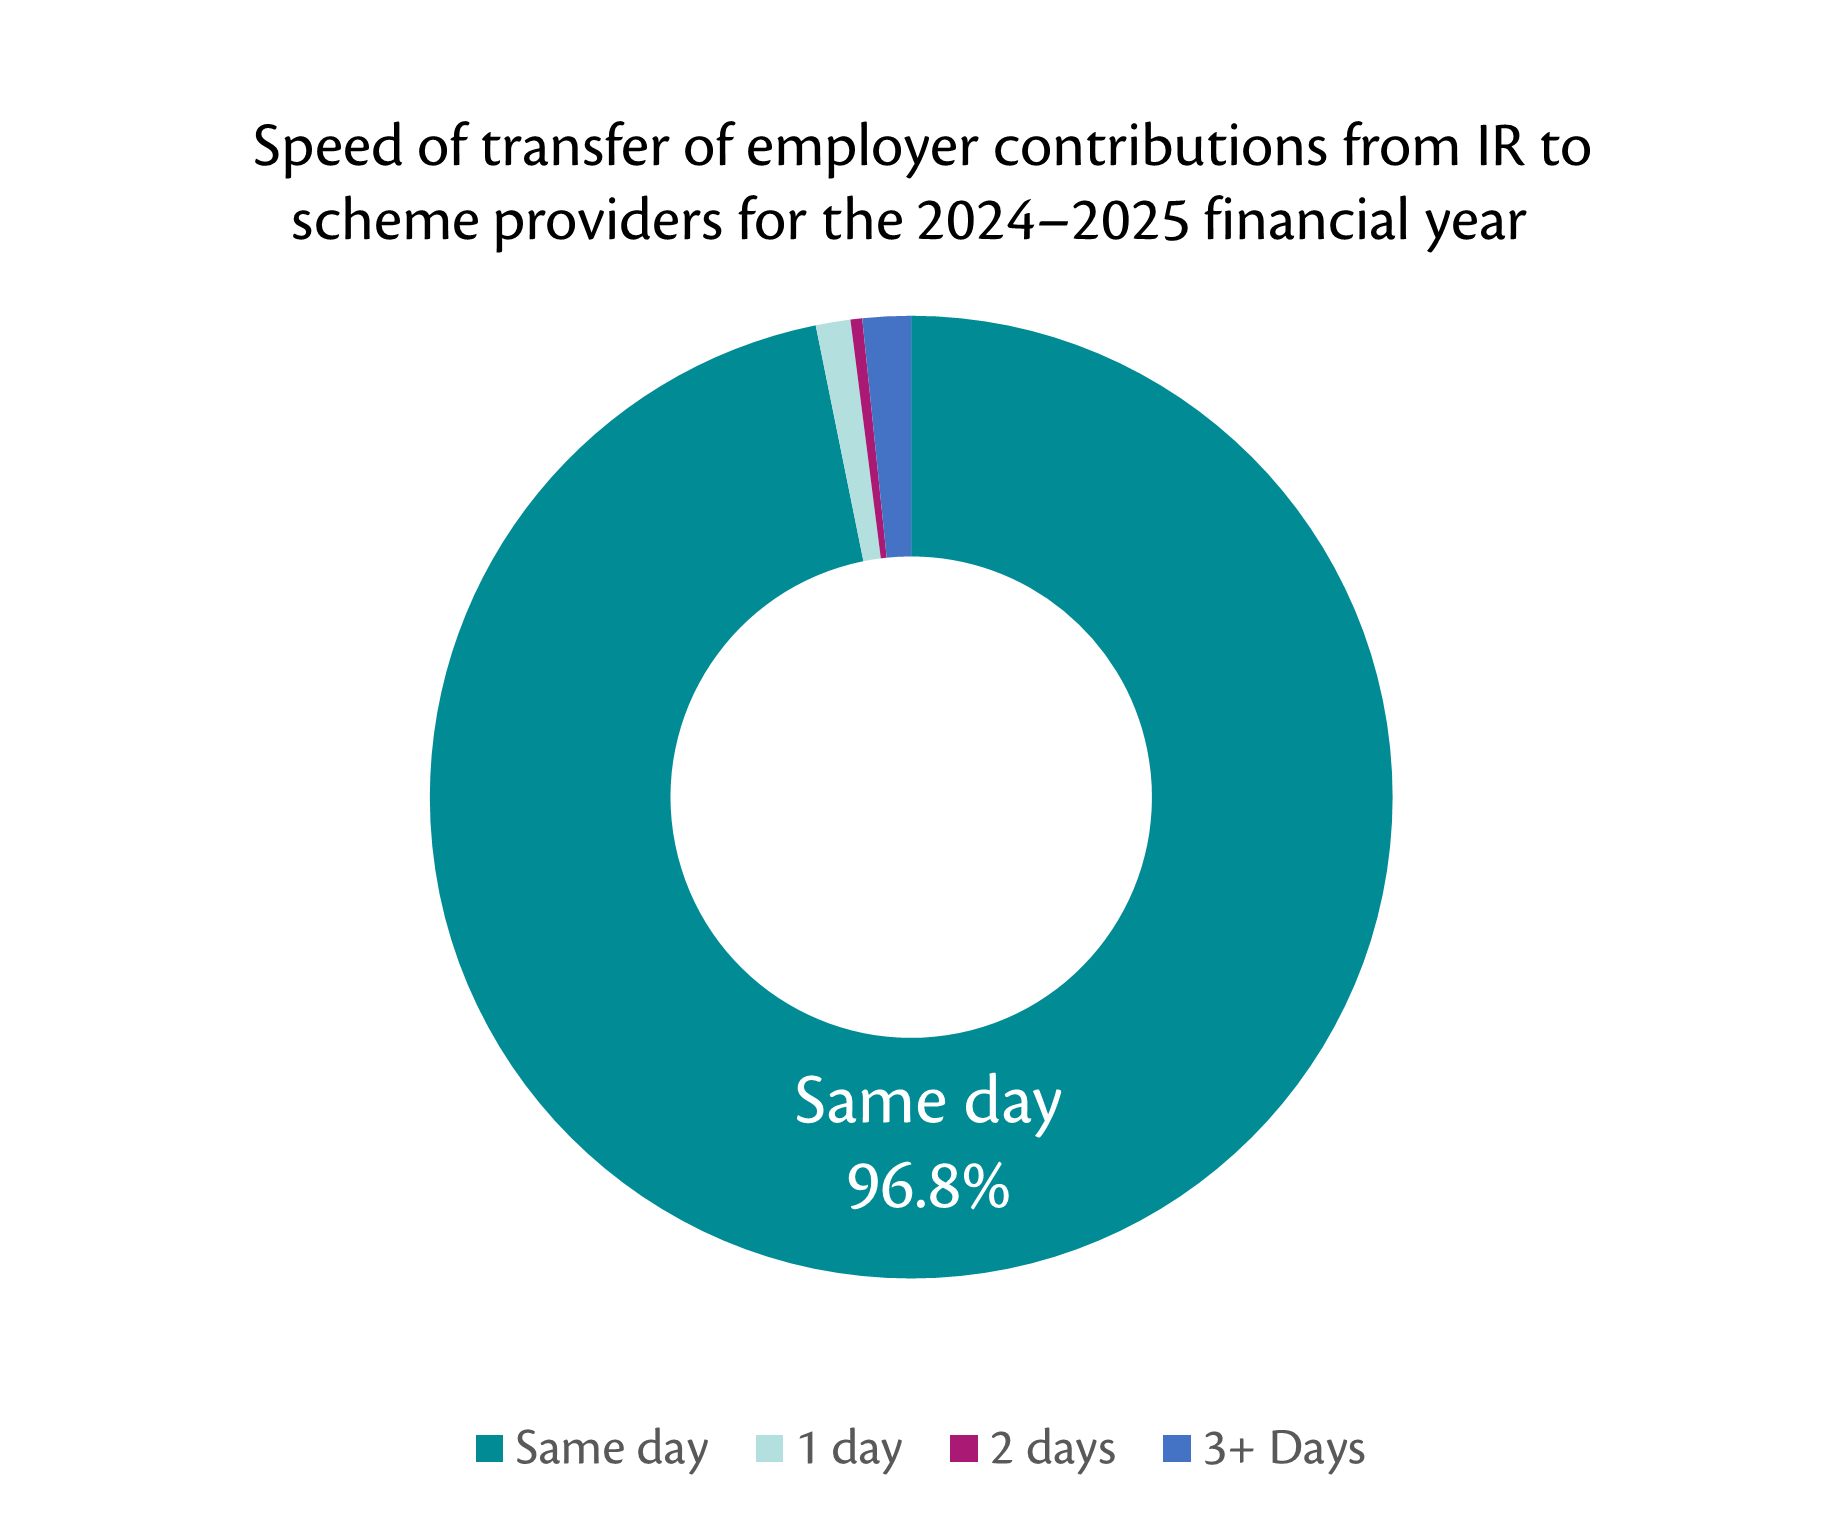
During the financial year to 30 June 2025:
- 96.8% of employee fund transfers were completed on the same day
- 1.2% of transfers were completed in 1 day
- 0.4% of transfers were completed in 2 days
- 1.6% of transfers were completed in 3 or more days.
Notes:
- Data excludes members in the 2-month provisional (holding) period.
- 2024–25 represents the overall result for July 2024 to June 2025.
- Inland Revenue had set a target to transfer 95% of KiwiSaver contributions to scheme providers within 3 days.
- For a month-to-month comparison, please refer to the annual Excel download located on the Datasets for KiwiSaver statistics page.
Speed of transfer of employee contributions from IR to scheme providers
This graph shows the speed of transfer of employee contributions from IR to scheme providers for the 2024–2025 financial year.
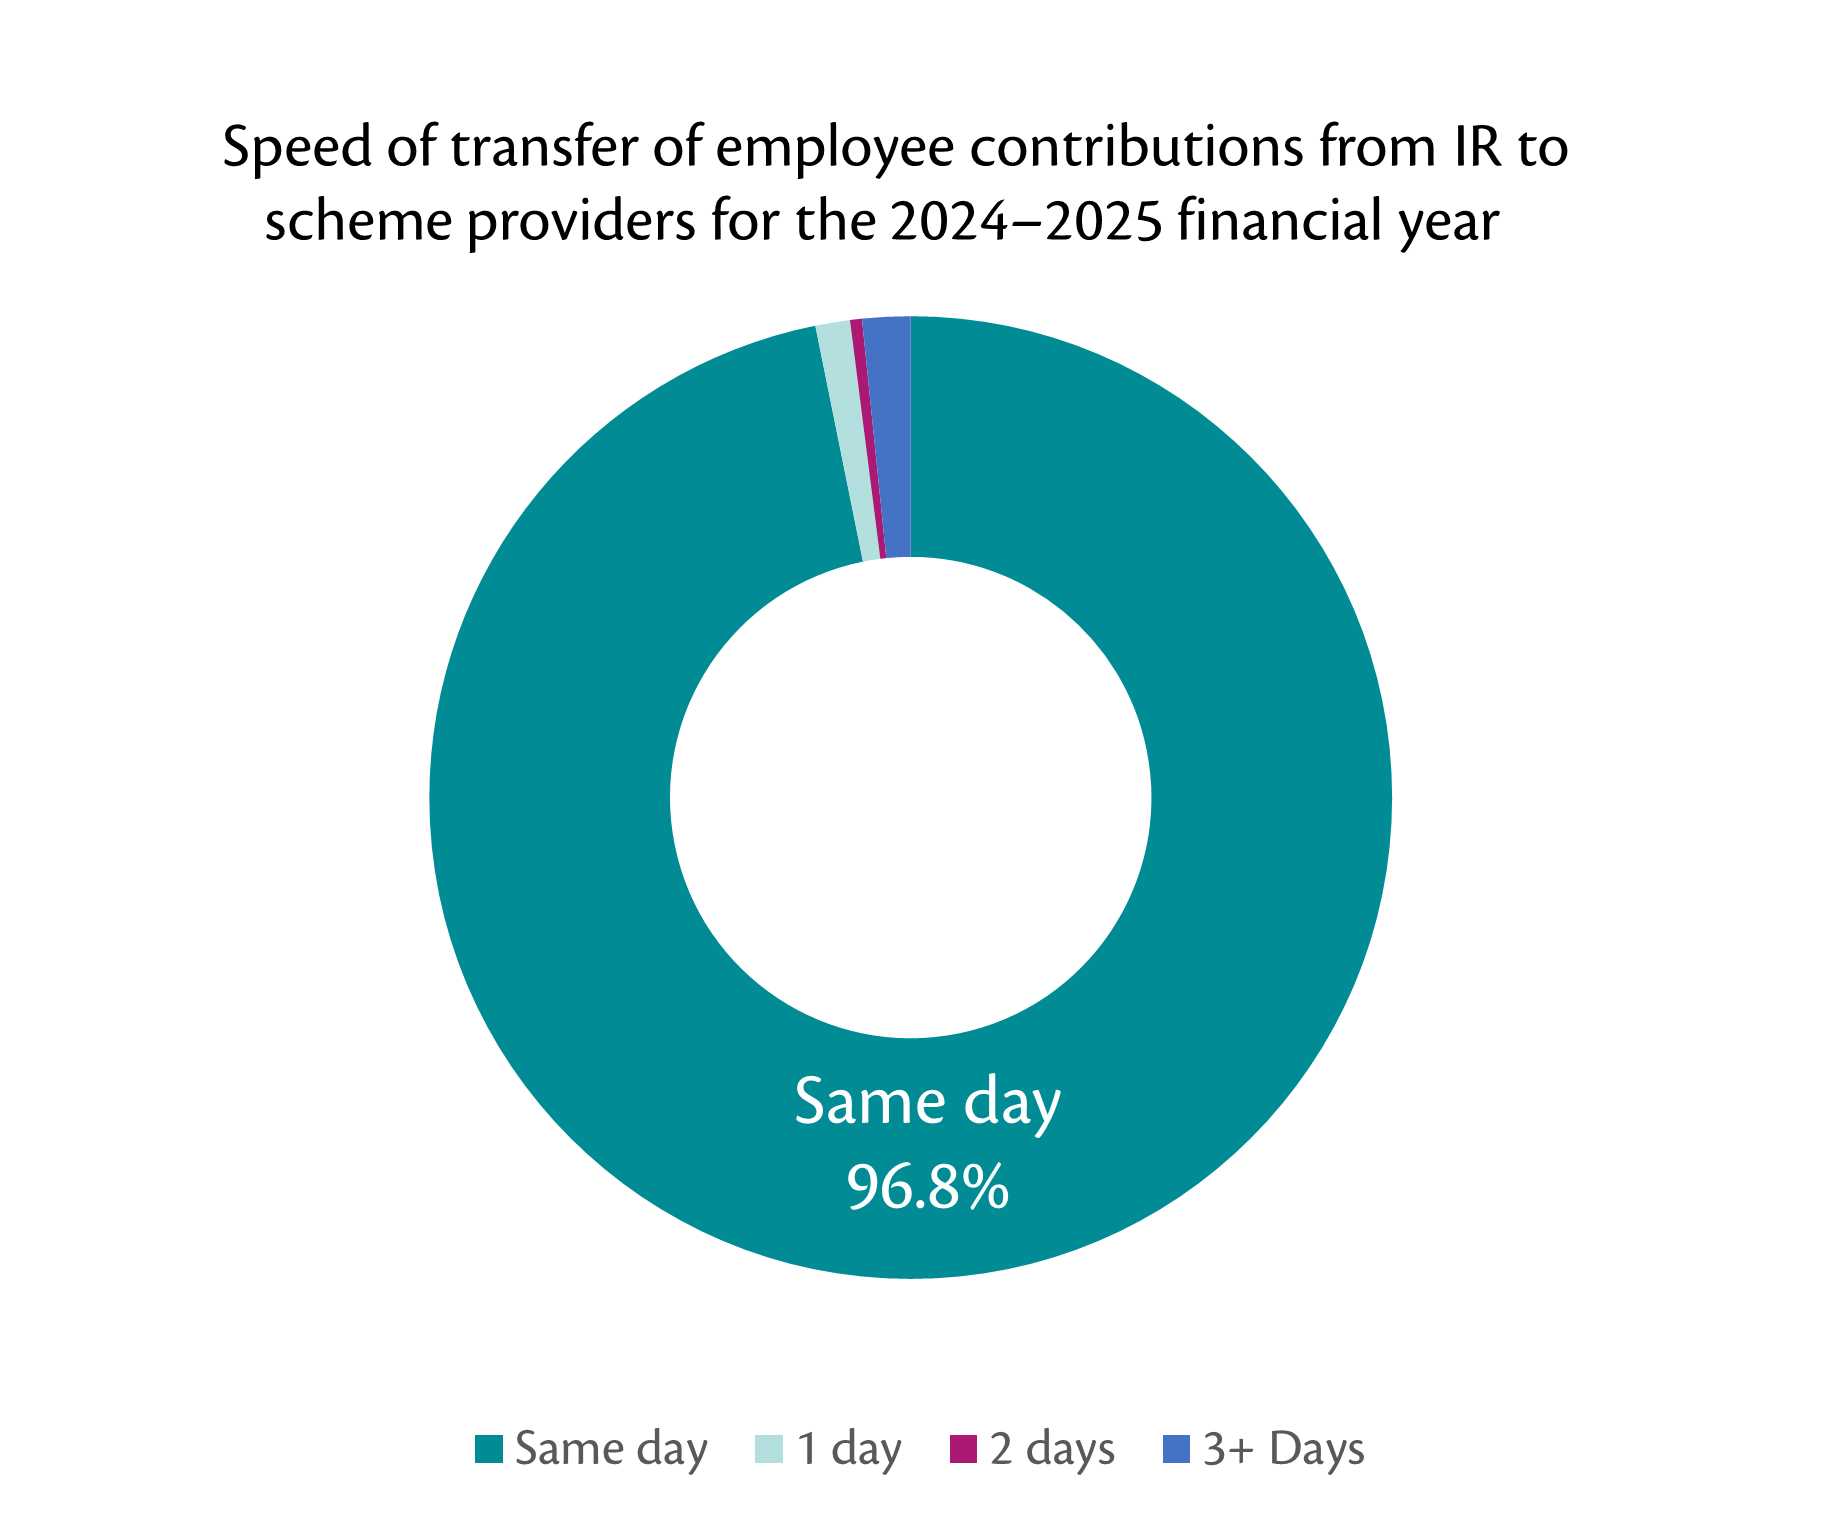
During the financial year to 30 June 2025:
- 96.8% of employer fund transfers were completed on the same day
- 1.2% of transfers were completed in 1 day
- 0.4% of transfers were completed in 2 days
- 1.6% of transfers were completed in 3 or more days.
Notes:
- Data excludes members in the 2-month provisional (holding) period.
- 2024–25 represents the overall result for July 2024 to June 2025.
- Inland Revenue had set a target to transfer 98% of KiwiSaver contributions to scheme providers within 3 days.
- For a month-to-month comparison, please refer to the annual Excel download located on the Datasets for KiwiSaver statistics page.