The proportion of individuals with wage and salary income over $150,000 has increased from 0.8% of salary and wage earners in 2005 to 6.5% in 2025. In 2025, 3.7% of wage and salary earners receive wage and salary income of $180,000 or more.
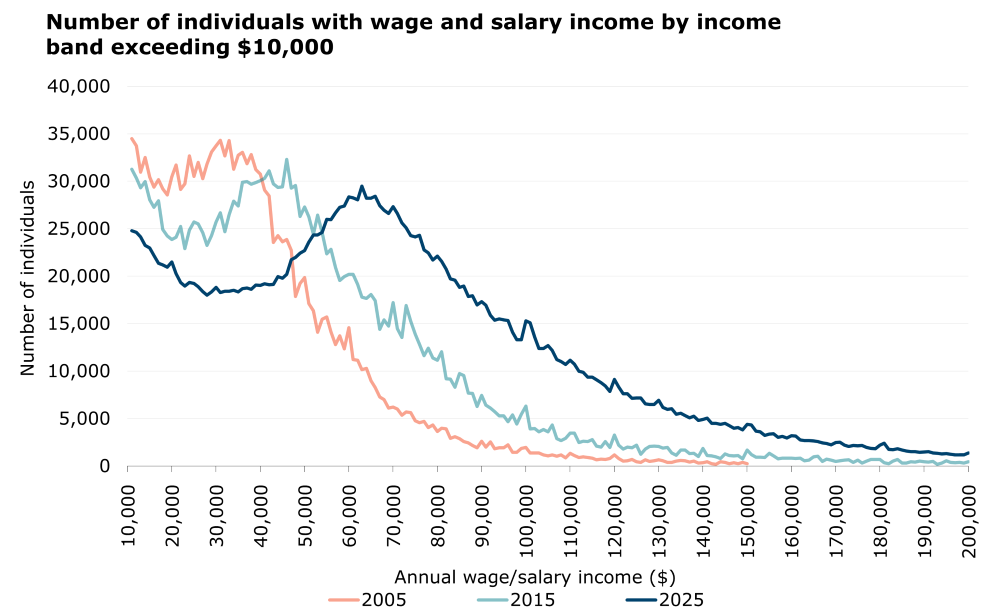
The graph above shows the number of individuals with wage and salary income by income band over $10,000. The number of individuals earning less than $10,000 in wage and salary is not shown in the graph but is in the tables that can be downloaded from the datasets page..
Wage and salary statistics datasets
The effect of increases to wages and salaries over the last 20 years plus an overall increase in the number of wage and salary earners has resulted in the mode wage and salary income amount increasing over time. In 2005, the mode wage and salary income band (for individuals earning over $10,000) was $31,000 and by 2025, the mode wage and salary income had increased to $63,000.