All current KiwiSaver data, including monthly data, is available in an Excel download located on the Datasets for KiwiSaver statistics page. Annual data is due to be uploaded by 30 September.
Datasets for KiwiSaver statistics
Payments to scheme providers, by category, as at 30 June
This graph shows the payments made to scheme providers, by category, as at 30 June 2025.
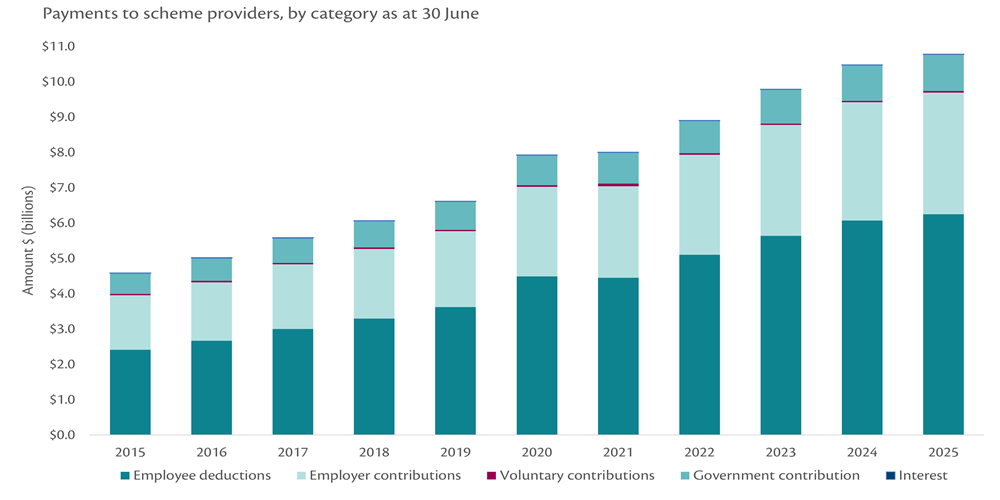
At the end of the 2025 financial year:
- $10.8 billion has been paid to scheme providers, up from $4.8 billion in June 2015
- $6.3 billion represents employee deductions, up from $2.4 billion in June 2015
- $3.4 billion represents employer contributions, up from $1.5 billion in June 2015
- $49 million represents voluntary contributions, up from $39 million in June 2015
- $3 million represents IR interest paid, down from $8 million in June 2015
- $1.0 billion represents government contribution, up from $580 million in June 2015.
Notes:
- Figures are gross and do not include payments refunded by providers to Inland Revenue.
- Figures do not include KiwiSaver contributions held by Inland Revenue.
- Government contribution figures represent all government contributions paid to KiwiSaver providers. Figures exclude government contributions paid to complying funds.
- Voluntary contributions include only those made through Inland Revenue, and exclude payments made directly to providers.
- Kick-start payments ceased on 21 May 2015.
- All figures are as at September 2025.
- From April 2020, KiwiSaver information is reported from a new system.
Payments to scheme providers by source as at 30 June
This graph shows the total amount of member and employer contributions made through Inland Revenue against the total amount of Crown contributions paid to scheme providers during each financial year.
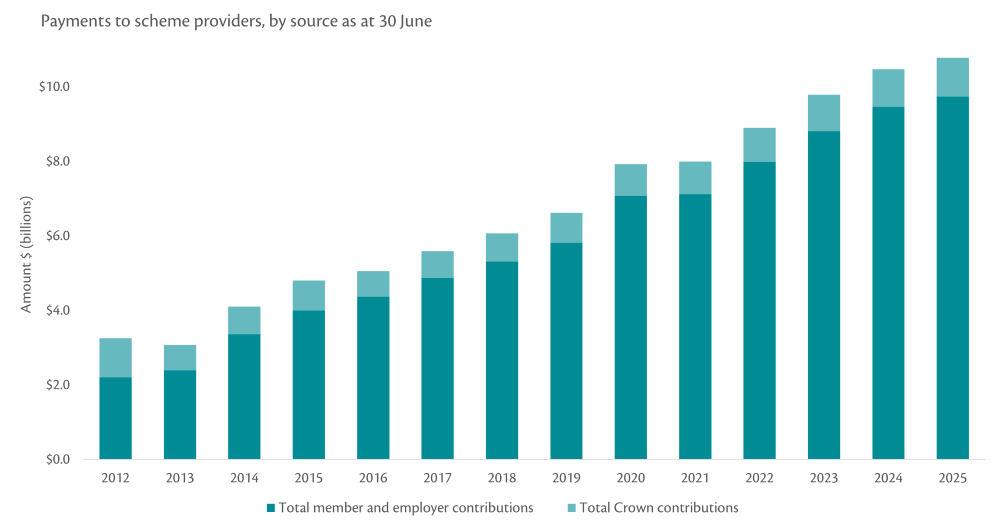
In the 2025 financial year:
- $9.7 billion member and employer contributions were paid to scheme providers, up from $4.0 billion in the 2015 financial year
- $1.0 billion crown contributions were paid to scheme providers, up from $804 million in the 2015 financial year.
Notes:
- Figures are gross and do not include payments refunded by providers to Inland Revenue.
- Figures do not include KiwiSaver contributions held by Inland Revenue.
- Government contribution figures represent all government contributions paid to KiwiSaver providers. Figures exclude government contributions paid to complying funds.
- Voluntary contributions include only those made through Inland Revenue, and exclude payments made directly to providers.
- Kick-start payments ceased on 21 May 2015.
- All figures are as at September 2025.
- From April 2020, KiwiSaver information is reported from a new system.
Funds transferred to scheme providers as at 30 June
| Payment category | 22/23 ($m) | 23/24 ($m) | 24/25 ($m) | Total (2008 - 2025) ($m) |
|---|---|---|---|---|
| Employee deductions | $5,642 | $6,074 | $6,252 | $55,450 |
| Employer contributions | $3,136 | $3,349 | $3,439 | $31,770 |
| Voluntary contributions | $35 | $39 | $49 | $625 |
| Total member and employer | $8,812 | $9,463 | $9,740 | $87,845 |
| Government contribution | $970 | $1,006 | $1,037 | $12,435 |
| Fee subsidy | $0 | $0 | $0 | $58 |
| Kick-start | $0 | $0 | $0 | $2,673 |
| Interest | $1 | $3 | $3 | $100 |
| Total Crown | $971 | $1,009 | $1,040 | $15,266 |
| Total payments to providers | $9,783 | $10,472 | $10,780 | $103,111 |
Notes:
- Figures are gross and do not include payments refunded by providers to Inland Revenue.
- Figures do not include KiwiSaver contributions held by Inland Revenue.
- Government contribution figures represent all government contributions paid to KiwiSaver providers. Figures exclude government contributions paid to complying funds.
- The voluntary contributions include only those made through IR, and do not include payments made directly to providers.
- Kick-start payments ceased on 21 May 2015.
- All figures are as at September 2025.
- From April 2020, KiwiSaver information is reported from a new system.
Number of KiwiSaver members by contribution rate, as at 30 June
| Contribution rate | Jun-23 | June-24 | June-25 |
|---|---|---|---|
| 3% | 1,160,363 | 1,169,537 | 1,164,017 |
| 4% | 329,993 | 315,833 | 304,488 |
| 6% | 107,086 | 116,521 | 123,925 |
| 8% | 117,485 | 107,929 | 101,016 |
| 10% | 92,053 | 98,378 | 105,208 |
| No contribution | 1,493,413 | 1,551,845 | 1,606,752 |
Notes:
- From 1 April 2019, the minimum employee contribution rate is 3% (this is also the default rate) of their gross salary or wages. Members can also opt for the 4%, 6%, 8% or 10% rate.
- The contribution rate is calculated from each member's final payday in June. If the member did not contribute through PAYE in that month they will appear as 'no contribution' in this table, even if they contributed in other months or outside of the PAYE system.
- Within the no contribution category there are members who are:
- children (under 18 and therefore may not be earning)
- not in work (including retirees)
- on a savings suspension
- receiving accident compensation, benefit, or paid parental leave which are not subject to compulsory deduction
- deceased and the account is not yet closed
- currently overseas
- contributing to other work-based savings schemes.
- Voluntary contributions include only those made through Inland Revenue, and exclude payments made directly to providers.
Members that have made a contribution to KiwiSaver through Inland Revenue, or scheme provider as at 30 June
| Jun-23 | Jun-24 | Jun-25 | |
|---|---|---|---|
| Total members | 3,353,164 | 3,447,256 | 3,486,291 |
| Made a contribution | 2,349,936 | 2,354,052 | 2,347,146 |
| % | 70% | 68% | 67% |
| No contribution | 1,003,228 | 1,093,204 | 1,141,521 |
| % | 30% | 32% | 33% |
Notes:
- 'Total members’ represents individuals who were KiwiSaver members at any time during the financial year.
- Information on those who contribute directly to scheme providers is only held by Inland Revenue, if advised by scheme providers as part of a claim for the government contribution.
- Within the no contribution category there are members who are:
- children (under 18 and therefore may not be earning)
- not in work (including retirees)
- on a savings suspension
- receiving accident compensation, benefit, or paid parental leave which are not subject to compulsory deduction
- deceased and the account is not yet closed
- currently overseas
- contributing to other work-based savings schemes.
- Voluntary contributions include only those made through Inland Revenue, and exclude payments made directly to providers.
Last updated:
30 Sep 2025