This section provides the composition of overdue tax debt and overdue child support debt by dollar value bands. The breakdown is presented for both the value of debt and the proportion of debt cases. The section covers the financial years from 2008 to 2017 (ending June). Due to rounding, the proportions may not always add to 100%.
The data for these statistics is available for download from the links at the bottom of the page.
Graph of debt value by debt value bands (tax debt)
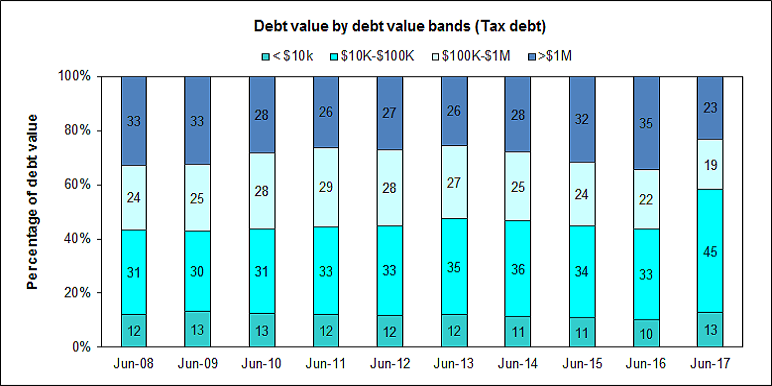
This graph shows the value of tax debt broken down by debt age for the 2008 to 2017 financial years (ending June).
This graph shows that from 2008 to 2016, the proportion of tax debt in each of the 4 debt value bands remained relatively stable. However, between 2016 and 2017, the following changes occurred:
- less than $10,000 increased from 10% to 13%
- between $10,000 and $100,000 increased from 33% to 45%
- between $100,000 and $1 million decreased from 22% to 19%
- more than $1 million decreased from 35% to 23%.
Graph of debt value by debt value bands (child support debt)
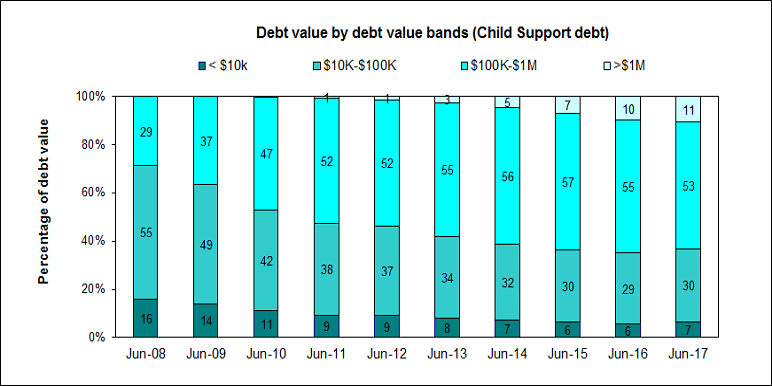
This graph shows the value of child support debt broken down by debt age for the 2008 to 2017 financial years (ending June).
From 2008 to 2017, the proportion of child support debt valued:
- less than $10,000 has more than halved, from 16% to 7%
- between $10,000 and $100,000 has decreased from 55% to 30%
- between $100,000 and $1 million has increased from 29% to 53%
- more than $1 million has increased from 0% to 11%.
Graph of debt value by debt value bands (total debt)
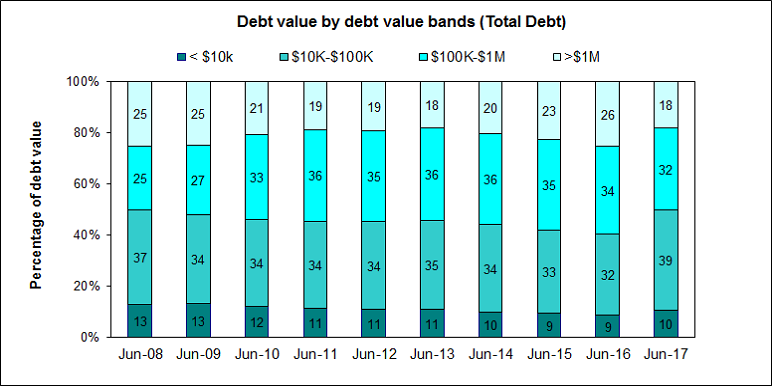
This graph shows the value of total debt (tax debt and child support debt combined) broken down by debt age for the 2008 to 2017 financial years (ending June).
From 2008 to 2017, the proportion of total debt valued:
- less than $10,000 has decreased from 13% to 10%
- between $10,000 and $100,000 has increased from 37% to 39%
- between $100,000 and $1 million has increased from 25% to 32%
- more than $1 million has decreased from 25% to 18%.
The shift over time of total debt value bands appears to have been driven, principally, by the changing composition of the value of child support debt rather than that of tax debt.