This section shows the total overdue tax debt, the overdue child support debt, the number of customers in debt, the number of debt cases, and the annual debt dynamics for the financial years 2008 to 2017.
The data for these statistics is available for download from the links at the bottom of the page
Graph of overdue debt cases (tax debt vs child support cases)
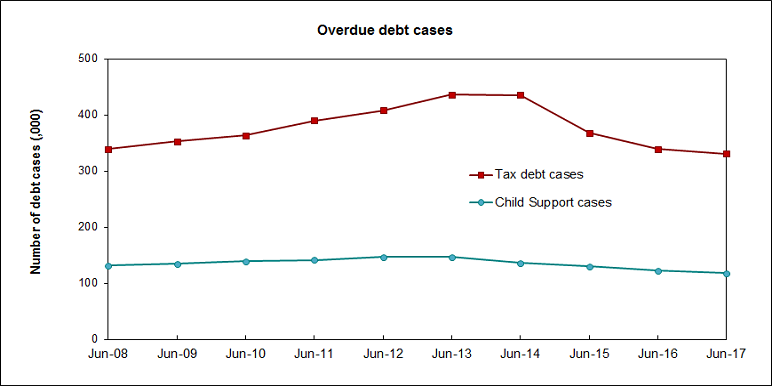
The graph has two lines, plotting the number of overdue debt cases for both tax debt and child support debt for the years ended June 2008 to June 2017.
From 2008 to 2017, the number of:
- overdue tax debt cases decreased by 2% (from 339,200 to 331,000). The number of tax debt cases peaked at 436,000 in 2013 but has fallen back since that time.
- overdue child support debt cases decreased by 11% (from 132,000 to 118,000).
Graph of overdue debt value
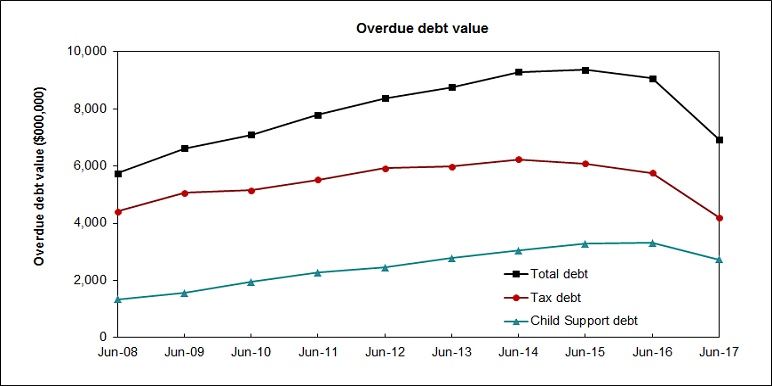
The graph has three lines, plotting the value of overdue debt for Total, Tax debt and Child Support debt for the years ended June 2008 to June 2017. Over the decade, the value of:
- Total overdue debt increased by 21% (from $5,751m to $6,935m)
- overdue tax debt decreased by 5% (from $4,413m to $4,199m)
- overdue child support debt increased by 105% (from $1,338m to $2,736m)
- The notable reduction in the year to 2017 in both overdue tax debt and overdue child support debt was due to sizeable debt write-offs that occurred.
Last updated:
28 Apr 2021