All current KiwiSaver data, including monthly data, is available in Excel downloads located on the Datasets for KiwiSaver statistics page. Annual data is due to be uploaded by 30 September.
Datasets for KiwiSaver statistics
Number of withdrawals from KiwiSaver funds by withdrawal reason each month
This graph shows the number of KiwiSaver fund withdrawals, by withdrawal reason, over the past 12 months.
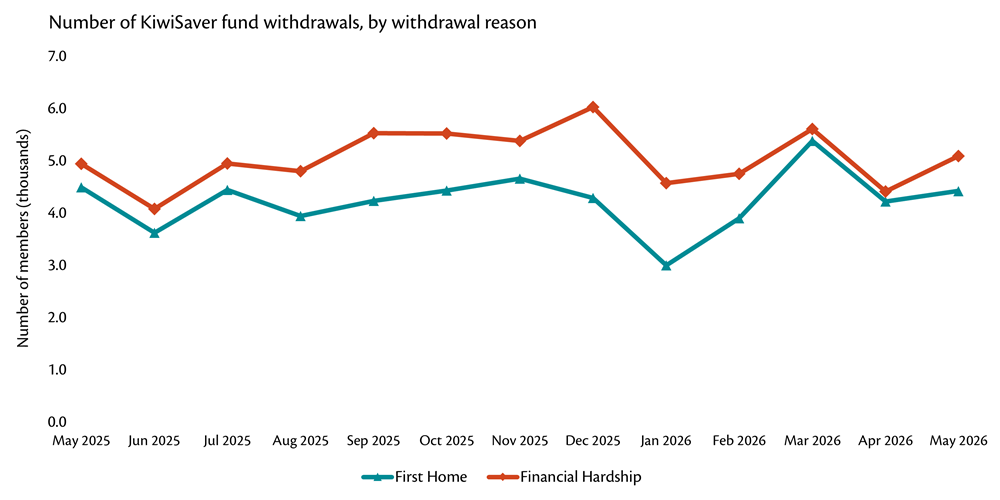
In May 2026:
- 9,520 members have withdrawn their savings for first home purchase or financial hardship, up from 9,420 in May 2025.
Of this number:
- 4,420 members have withdrawn their savings for the purpose of first home purchase, down from 4,490 in May 2025.
- 5,090 members have withdrawn their savings due to financial hardship, up from 4,940 in May 2025.
Notes:
- Figures are what has been provided by Scheme Providers to Inland Revenue and may not be 100% of all of these type of fund withdrawals.
- Figures do not cover all types of withdrawals. For example, Inland Revenue does not capture retirement withdrawals.
- Figures represent a distinct count of members.
- Figures are rounded to the nearest 10.
- Members can withdraw funds under both categories within the same period.
- Members can withdraw funds in more than one month, therefore monthly counts cannot be summed to find the number of members who made withdrawals during a year.
- Data for each month is as at a point in time and does not reflect any subsequent reversals or late approvals.
Number of KiwiSaver fund withdrawals, by withdrawal reason as at 30 June
This graph shows the number of KiwiSaver fund withdrawals, by withdrawal reason, as at 30 June 2025.
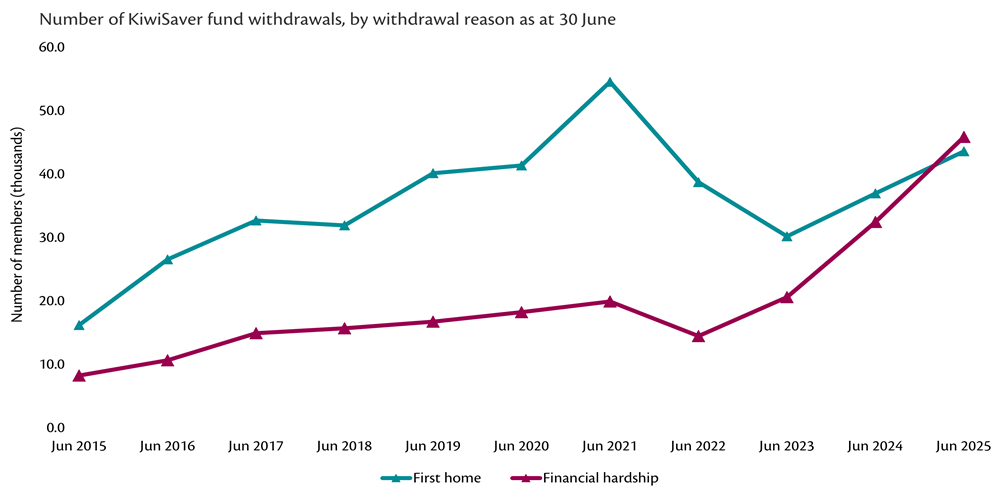
In the 2024–2025 financial year:
- 43,600 members have withdrawn their savings having purchased a first home, up from 16,180 in the 2015 financial year
- 45,870 members have withdrawn their savings due to financial hardship, up from 8,250 in the 2015 financial year.
Notes:
- Data has been provided to Inland Revenue from scheme providers, and may not be 100% of all of these type of fund withdrawals.
- Data does not cover all types of withdrawals, for example, Inland Revenue does not capture retirement withdrawals.
- The data represents a distinct count of members.
- The data may include members who withdrew funds under both categories during the year.
- Figures are rounded to the nearest 10.
- Data from June 2020 through to June 2024 was updated as at July 2024.
- From April 2020, KiwiSaver information is reported from a new system.
Last updated:
23 Jun 2026