In the 2024 tax year, 4,693,920 individuals are included in these distributions. That number is a 3.2% increase compared to the 2023 tax year.
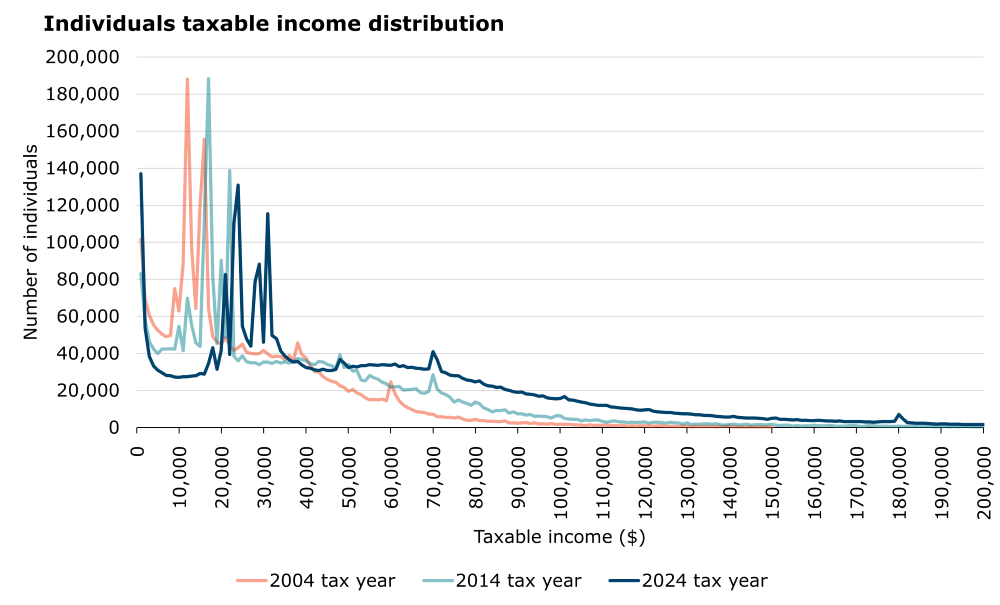
The above graph shows the number of individuals by income tax band for the 2004, 2014 and 2024 tax years. Individuals with taxable income between $0 and $100 are not included in the above graph. This is because of high numbers and small amounts in total. You can download the data for these groups on the page Tax on taxable income datasets.
Tax on taxable income datasets
The graphed distributions show spikes of increased numbers of individuals at various taxable income levels below $35,000. This reflects transfers of income-tested taxable benefits and New Zealand Superannuation. There are other spikes near the personal tax thresholds of $48,000, $70,000 and $180,000, where the personal tax rate increases. In the 2004 tax year the thresholds were different, and the spikes were at $38,000 and $60,000 of taxable income.
The graphed distributions stop at $150,000 of taxable income for the 2004 tax year and $200,000 income for 2014 and 2024 tax years. The upper limits are available in the download link on the page Tax on taxable income datasets.