This page shows overdue tax and entitlement debt by product, tax and entitlement debt by age of debt, and tax and entitlement debt by customer type, as at the end of each quarter. It is updated annually.
This data is provided through an Excel file located at the bottom of this page.
Inland Revenue has made technical adjustments to the definitions of overdue tax debt for the 2024 financial year. During 2024, $867 million was reclassified as overdue debt. Excluding this reclassified debt, the increase from 2023 to 2024 was $1.28 billion. For more information, please refer to page 23 of the Inland Revenue Annual Report 2024. In 2025, Inland Revenue updated the definition of when tax debt becomes overdue to ‘straight after the due date’. For more information, please refer to page 44 of the Inland Revenue Annual Report 2025.
Total amount of tax and entitlement debt by product as at the end of each quarter
This graph shows the amount of debt at each quarter, split by product and number of customers with debt up to 30 June 2025.
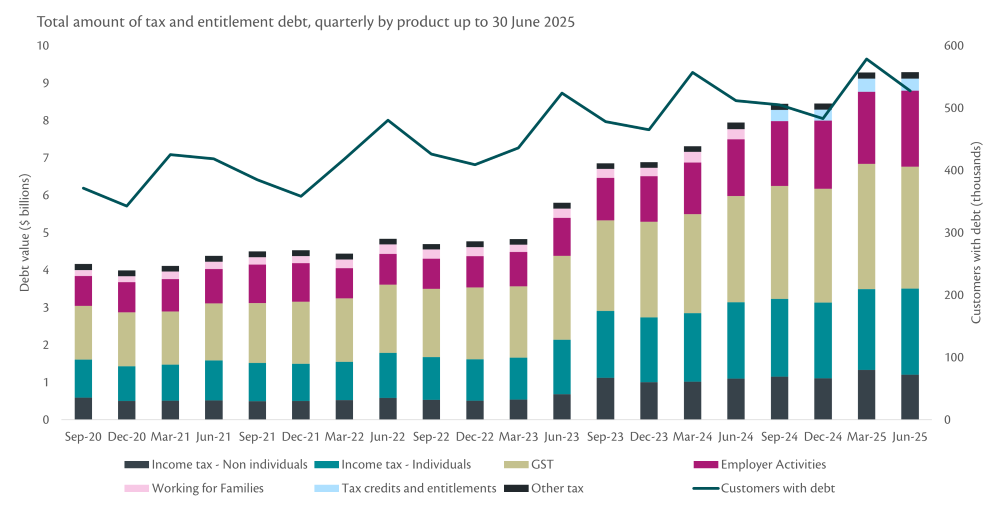
As at 30 June 2025:
- Income tax (individuals) debt increased from $2.0 billion in June 2024 to $2.3 billion in June 2025.
- Income tax (non-individuals) debt increased from $1.1 billion in June 2024 to $1.2 billion in June 2025.
- GST debt increased from $2.8 billion in June 2024 to $3.3 billion in June 2025.
- Employer activities debt increased from $1.5 billion in June 2024 to $2.0 billion in June 2025.
- Tax credits and entitlements debt was $322.9 million in June 2025.
- Other tax debt decreased from $175.7 million in June 2024 to $171.4 million in June 2025.
- Customers with tax debt increased from 512,000 in June 2024 to 527,000 in June 2025.
- Total tax and entitlement debt increased from $7.9 billion in June 2024 to $9.3 billion in June 2025.
Notes:
- The rise and fall of the number of customers with tax debt coincides with key filing dates.
- How IR mitigates debt growth is covered in IR’s annual reports.
- Data is taken as at the last day of the month specified.
- Tax and entitlement debt excludes child support, student loans and small business cashflow loans. Debt relating to covid support payment, resurgence support payment and cost of living payment were excluded until the 2025 financial year.
- Other tax includes approved issuer levy, dividend withholding tax, donation tax credit, fringe benefit tax, gaming machine duty, goods and services sold in satisfaction of debt, lottery duty, non-resident withholding tax, offshore gambling duty, portfolio investment entity, resident withholding tax, resident withholding tax, residential land withholding tax and resident withholding tax on interest.
- Employer activities includes debt relating to PAYE, KiwiSaver employer contributions, KiwiSaver employee contributions, employer superannuation contributions tax, student loan employer deductions and child support employer deductions.
- From the 2025 financial year, Working for Families is now included in the tax and entitlements section. The tax and entitlements section includes debt arising from Working for Families tax credits, FamilyBoost, resurgence support payment, covid support payment and cost of living payment.
- In 2020 there was a significant upgrade to our systems which changed the way debt was reported. The number of customers with tax debt is only available from September 2020 onwards.
Total amount of tax and entitlement debt by age of debt as at the end of each quarter
This graph shows the amount of debt, split by age of debt (under 2 years and over 2 years), up to 30 June 2025.
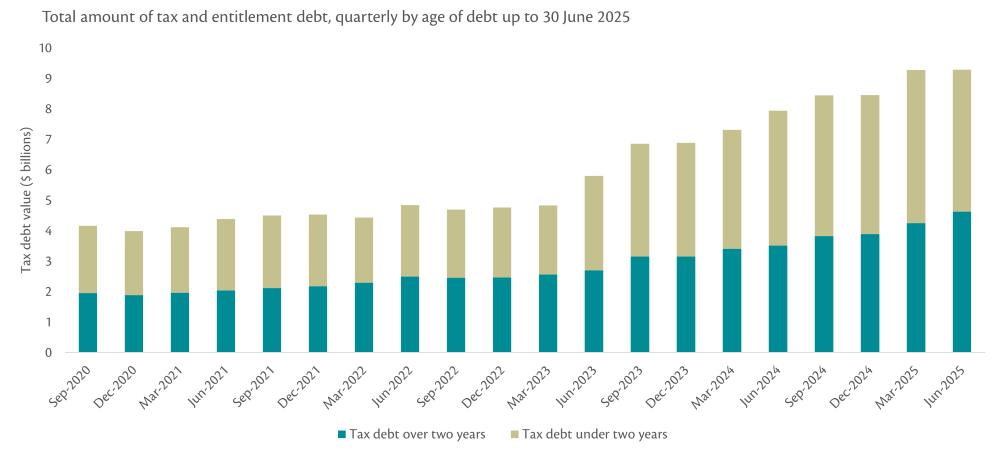
As at 30 June 2025:
- Tax and entitlement debt over 2 years old debt increased from $3.5 billion in June 2024 to $4.8 billion in June 2025.
- Tax and entitlement debt under 2 years old debt increased from $4.4 billion in June 2024 to $4.5 billion in June 2025.
Notes:
- Data is taken as at the last day of the month specified.
- Tax and entitlement debt excludes child support, student loans and small business cashflow loans. Debt relating to covid support payment, resurgence support payment and cost of living payment were excluded until the 2025 financial year.
Total amount of tax and entitlement debt by customer type as at the end of each quarter
This graph shows the amount of tax debt owed by customers, split by customer type, up to 30 June 2025.
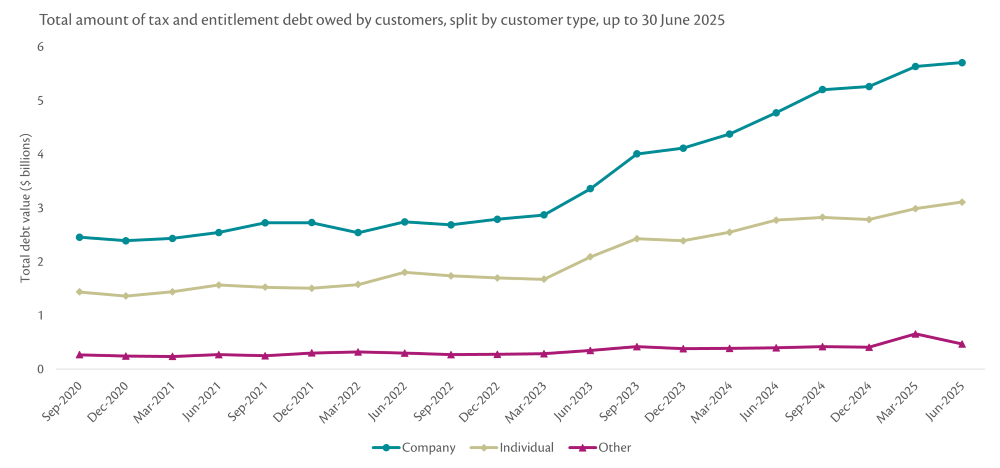
As at 30 June 2025:
- Tax and entitlement debt for companies debt increased from $4.8 billion in June 2024 to $5.7 billion in June 2025.
- Tax and entitlement debt for individuals debt increased from $2.8 billion in June 2024 to $3.1 billion in June 2025.
- Tax and entitlement debt for other entities debt increased from $396.7 million in June 2024 to $471.3 million in June 2025.
Notes:
- Data is taken as at the last day of the month specified.
- Tax and entitlement debt excludes child support, student loans and small business cashflow loans. Debt relating to covid support payment, resurgence support payment and cost of living payment were excluded until the 2025 financial year.
- Other entities are all customers that are not individuals or companies. This includes embassies, high commissions, holding accounts, government entities, Māori authorities, partnerships, societies/clubs, superannuation scheme providers, trusts, and unit trusts.