A shortfall penalty (SFP) is one imposed as a percentage of a tax shortfall (a deficit or understatement of tax), resulting from certain actions on the part of a taxpayer. The information shows the number and value of shortfall penalties in total and by category.
The data for these statistics is available for download from the links at the bottom of the page.
Graph of the number of shortfall penalty impositions from 2007 to 2016
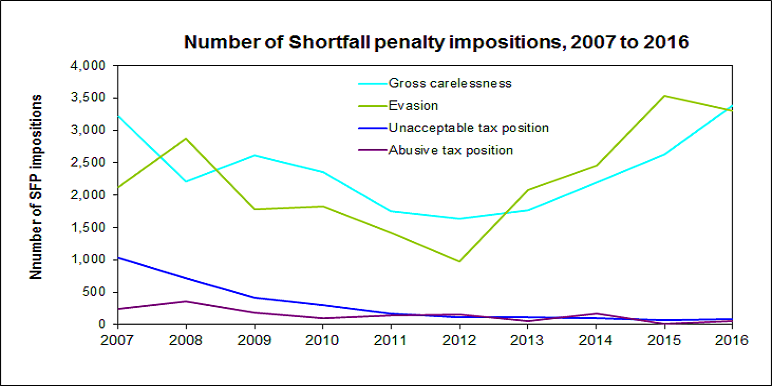
This graph has four lines showing the number of impositions, for the following types of Shortfall penalty offences:
- Unacceptable tax position.
- Gross carelessness.
- Abusive tax position.
- Evasion
From 2007 to 2016, the number of shortfall penalties imposed for:
- Unacceptable tax position decreased 92% (from 1,038 to 84)
- Gross carelessness increased 5% (from 3,218 to 3,382)
- Abusive tax position decreased 74% (from 246 to 63)
- Evasion increased 56% (from 2,120 to 3,301).
Graph of the number of total shortfall penalty impositions and Not taking reasonable care from 2007 to 2016
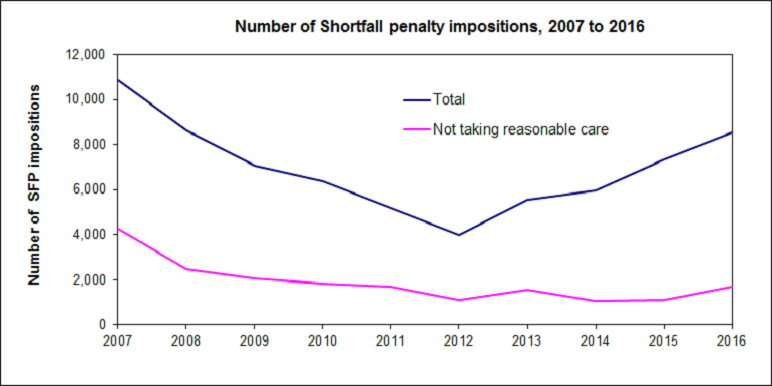
This graph has two lines showing the total number of shortfall penalty impositions and the number of SFP impositions for not taking reasonable care.
From 2006 to 2015, the number of shortfall penalties for:
- Total decreased 22% (from 10,871 to 8,516)
- Not taking reasonable care offences decreased 60% (from 4,249 to 1,686).
Graph of shortfall penalty impositions by value from 2007 to 2016
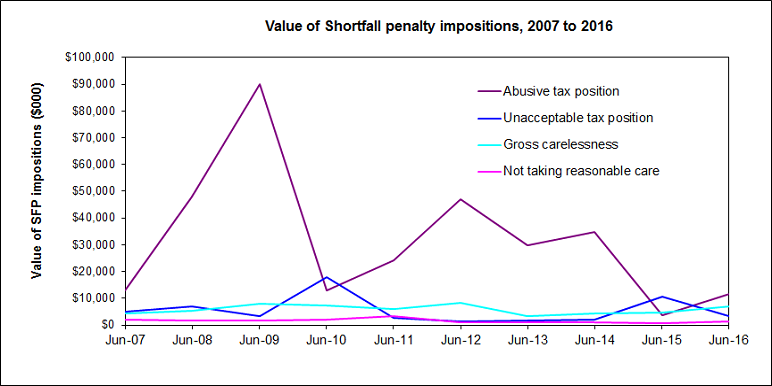
This graph has four lines showing, by value, the following types of shortfall penalty offences:
- Unacceptable tax position.
- Gross carelessness.
- Abusive tax position.
- Evasion
From 2007 to 2016, the value of shortfall penalties for:
- Unacceptable tax position decreased 30% (from $4,833,895 to $3,389,688)
- Gross carelessness increased 54% (from $4,439,627 to $6,855,925)
- Abusive tax position decreased 99% (from $12,797,907 to $114,654)
- Evasion decreased 2% (from $11,870,617 to $11,574,245).
Graph of value for total shortfall penalty impositions and evasion from 2007 to 2016
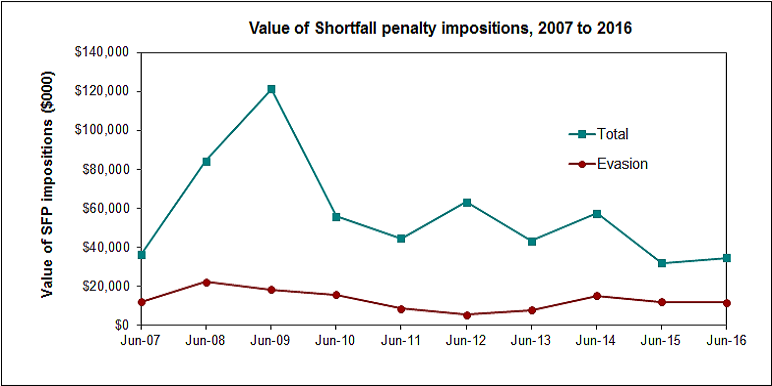
This graph has two lines showing the total value shortfall penalty impositions and that for evasion offences.
From 2007 to 2016 the value of shortfall penalties for:
- Total decreased 4% (from $35,994,420 to $34,498,876)
- Evasion offences decreased 2% (from $11,870,617 to $11,574,245).
Change in methodology for the calculation of Shortfall Penalty Impositions
Shortfall penalty numbers are based on the number of times the shortfall penalties are imposed in the financial year regardless of whether the related audit cases are closed in the same year. Prior to 2016, they were based on the number of customers who had shortfall penalties imposed.