
For the 2025 tax year to date, there have been a total of $1,085 million in donations for which donation tax credits (DTC) were paid.
DTC can be claimed for up to 4 years after the end of the tax year. Based on previous claims history, Inland Revenue expects to receive a further $3 million to $7 million in claims for the 2024 tax year, and a further $10 million to $15 million in claims for the 2025 tax year.
Donations to schools and kindergartens, religious organisations and other organisations
We track donations given to:
- schools and kindergartens
- religious organisations
- other donee organisations.
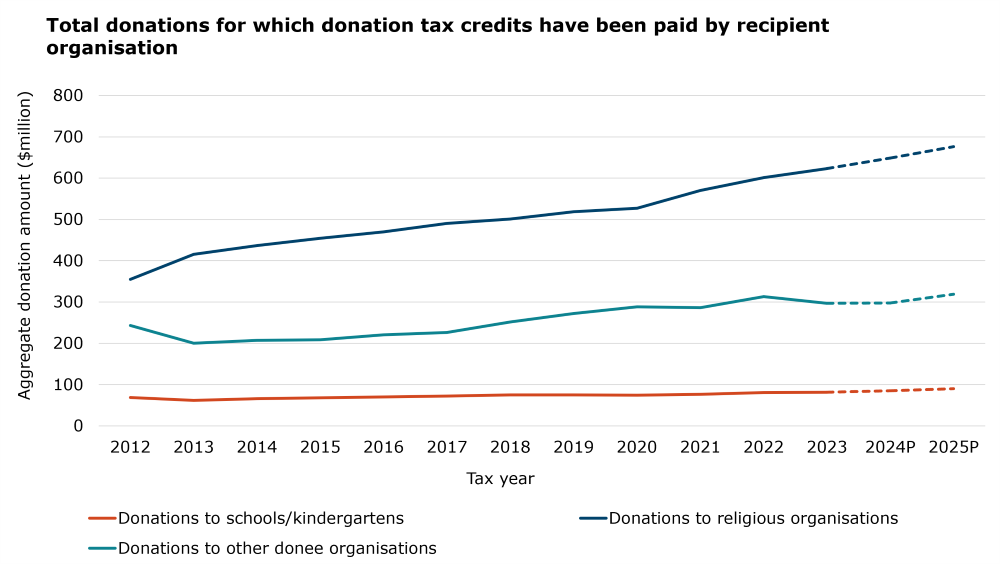
P – statistics released for 2024 and 2025 are provisional totals, and will be revised in future releases.
This graph shows the change in donations paid to schools and kindergartens, religious organisations and other organisations between 2012 and 2025. Over the last 5 years, the graph shows that:
- donations to schools and kindergartens have increased 19%, from $75 million in 2020 to $89 million in 2025
- donations to religious organisations have increased 28%, from $527 million in 2020 to $673 million in 2025
- donations to other organisations have increased 10%, from $289 million in 2020 to $318 million in 2025.
Donation claims by age
Donations to different donation categories vary across age groups. In this one-off analysis, we publish the 5-year median aggregate donation claims for each age band by year, measured across the 2021 to 2025 tax years.
The median of the 5 years for each age band is used to avoid distortions from one-off amounts received in any 1 year. The age of donors is calculated at 31 March of the relevant tax year.
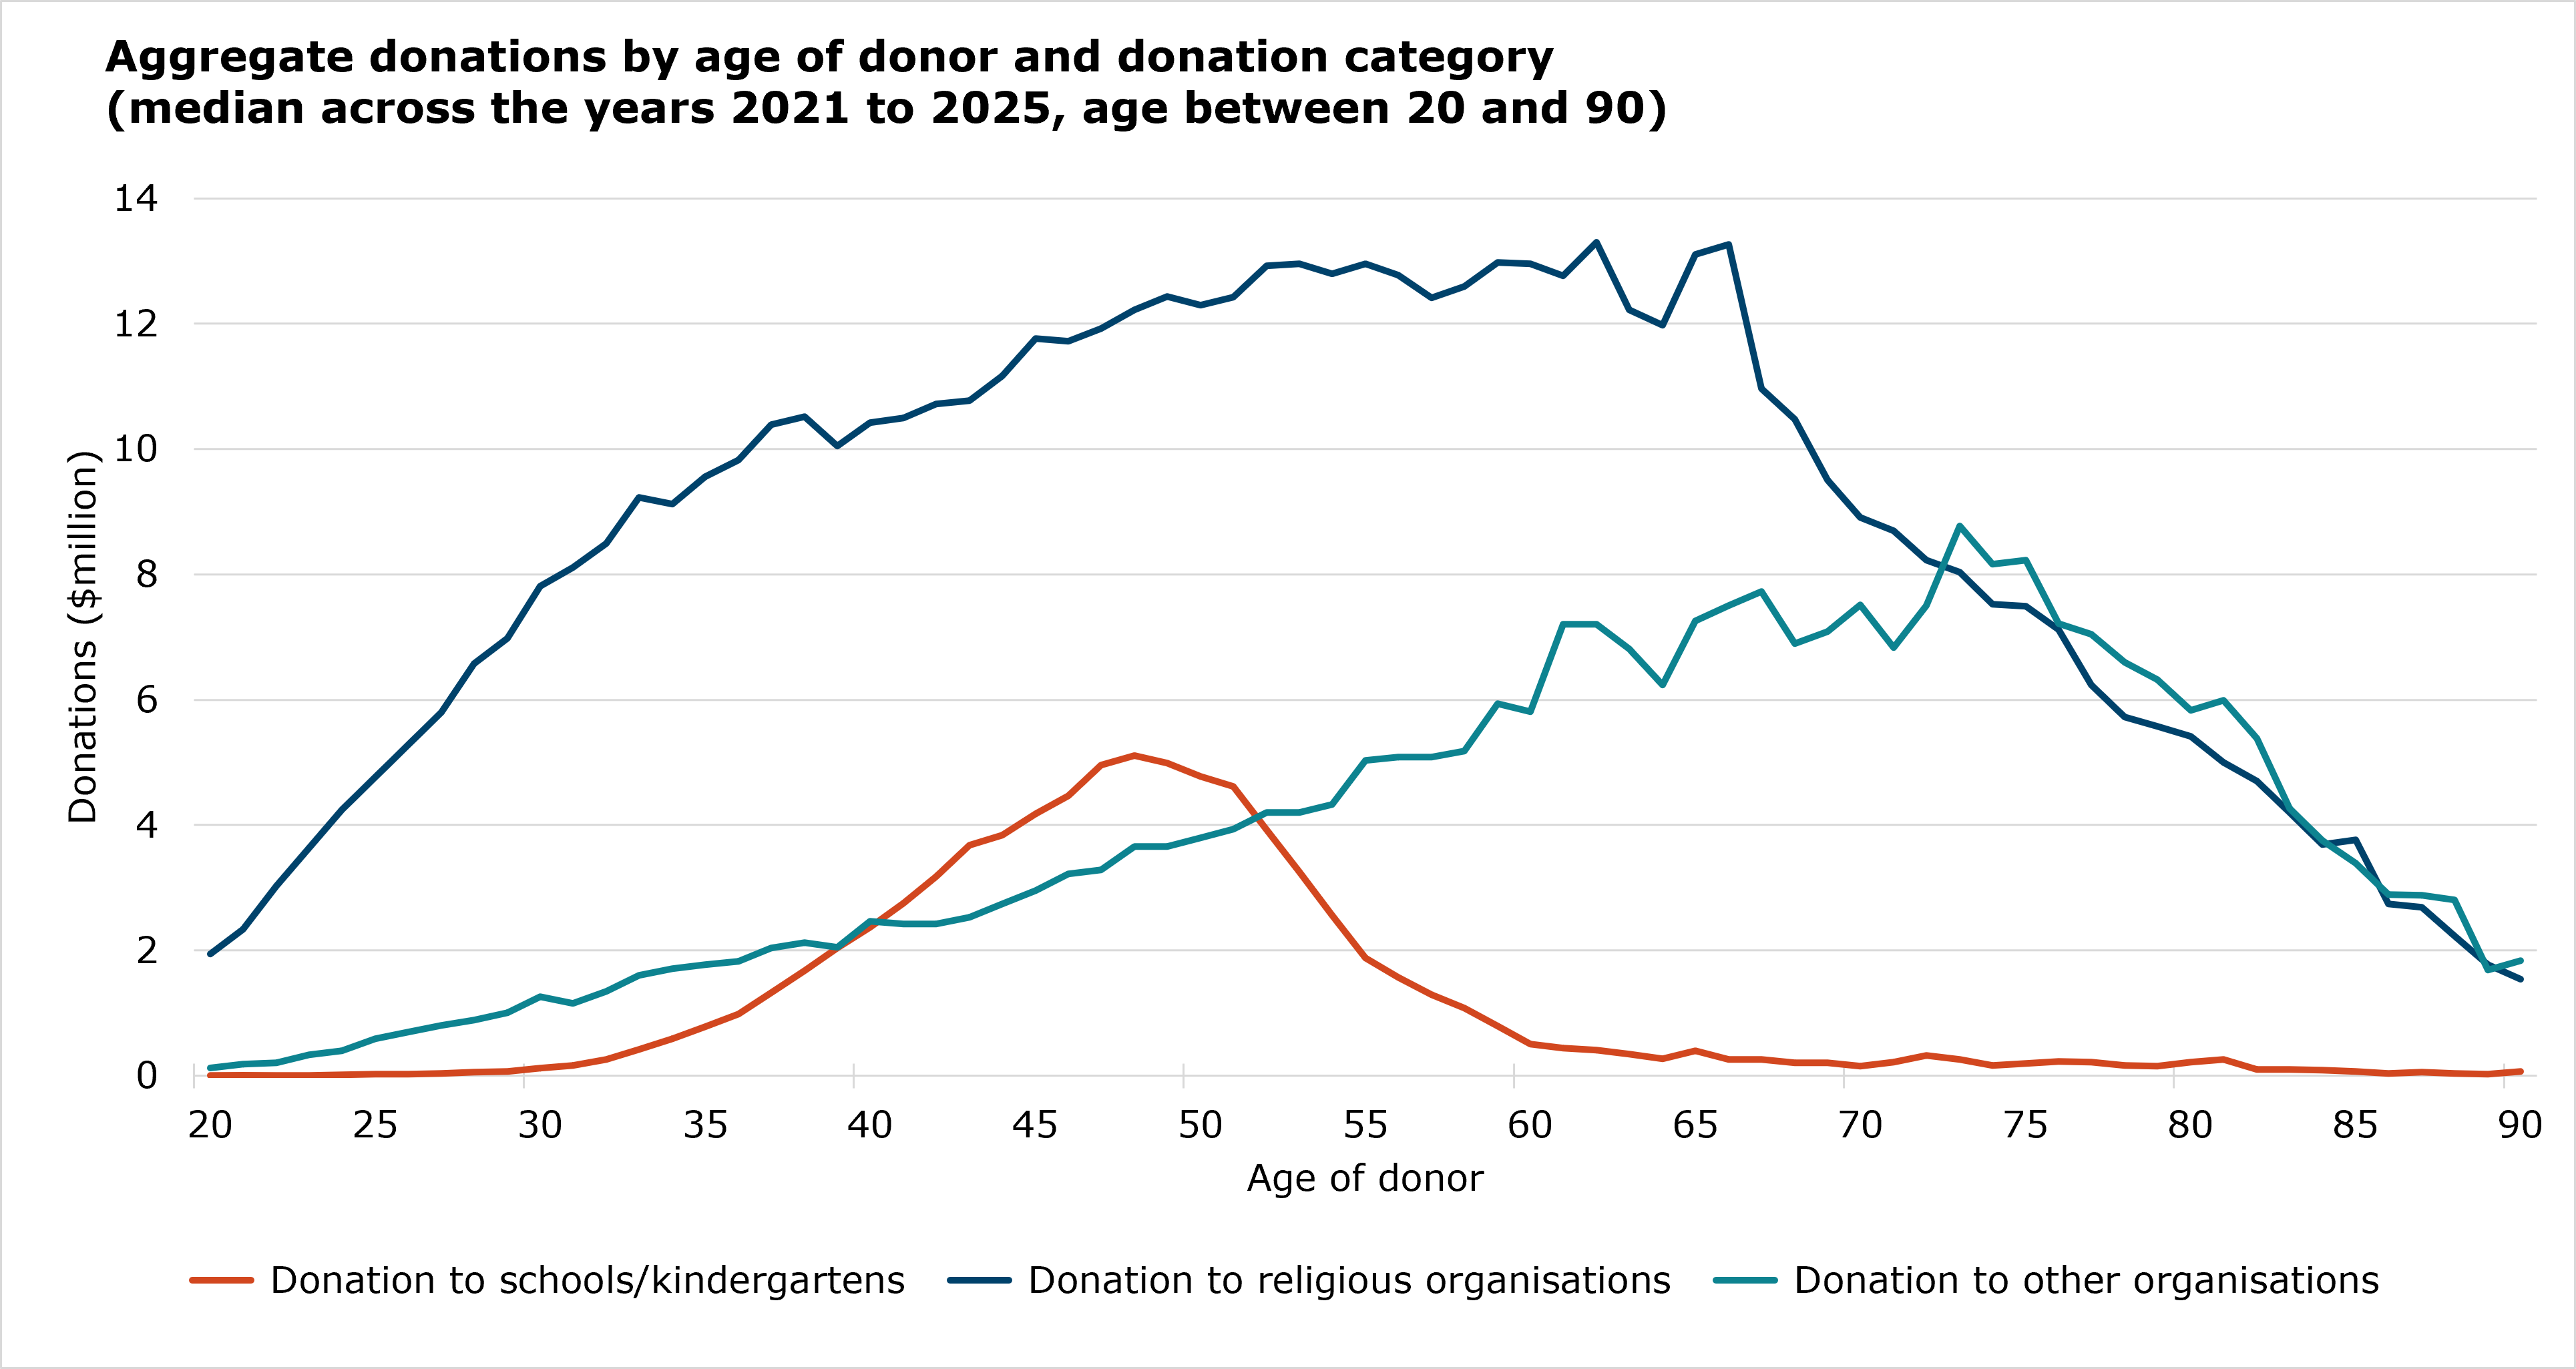
This chart illustrates how donation patterns vary across individuals’ life-stages for the 3 donation categories. The chart shows the following.
- Donations to religious organisations is the largest donation category through most of adulthood. Donations rise rapidly from the late teens, peak in the mid-50s and gradually decline in older age groups.
- Donations to schools is concentrated in midlife, peaking in the mid-40s to early-50s, reflecting periods when people are most connected to schools.
- Donations to other organisations increase steadily with age, suggesting charitable interests broaden and diversify later in life.